Budgeting & Forecasting
Only available in the Business Suite version of Business Accountz
Introduction
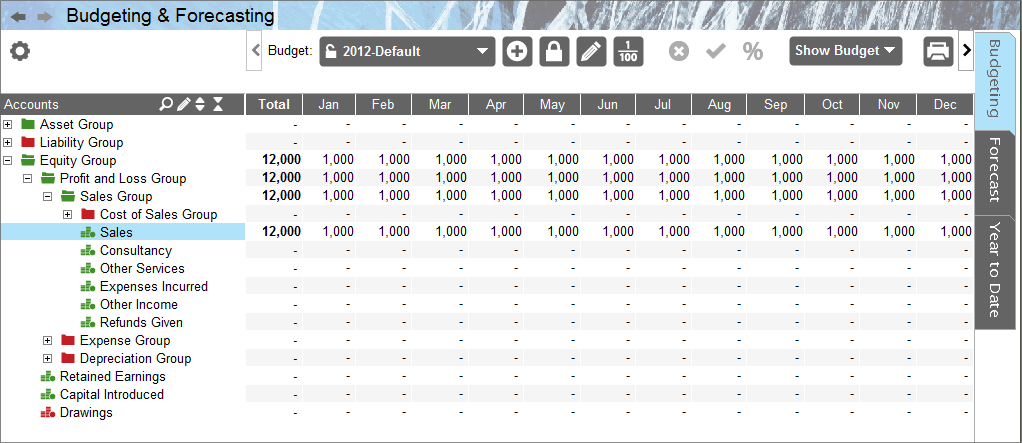
The Budgeting component allows you to define a Budget at the start of your financial year, maintain a Forecast and produce Year to Date reports throughout the financial year.
To access the Budgeting and Forecasting component click on the icon in the tool bar, or select the “Chart of Accounts>Budgeting and Forecasting” menu option to access the screen.
On the right of the screen are three tabs:
- The Budget Tab - is where you enter your projected 12 month budget for one or more accounts within the ‘Profit and Loss Group’.
- The Forecast Tab - shows a monthly breakdown of your year to date figures, plus your projected figures for the remaining months of the set period, combined to show a Forecast total for the year as it stands.
- The Year to Date Tab - compares your projected Budget totals against your Forecast and Actual totals.
Each tab allows you to independently select which budget you want to look at in that particular tab. Changing the selected budget in one tab will not alter the selected budget in the other tabs.
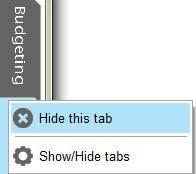
Note: you can hide/show these tabs by right-clicking on them and selecting the corresponding menu item
Budget Tab
Tool Bar
The tool bar consists of:
Select Budget

This drop down box allows you to pick which budget (you may have some from past years) to view/edit.
The ‘pad lock’ symbol by the name of the budget denotes if the budget has been Locked.
Create a New Budget

Click this button to create a new budget. After clicking this button the ‘Create a new Budget’ pop-up will appear:
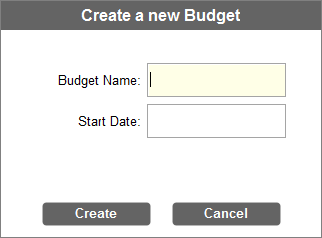
Here you can set the:
- Budget Name - the given name for the budget
- Start Date - the date for the start of your financial year
Lock Budget

This button allows you to lock a budget from editing. To unlock a locked budget you must use the Edit pop-up.
Edit Budget

Click this button to edit the current budget. After clicking this button the ‘Edit Budget Properties’ pop-up will appear:
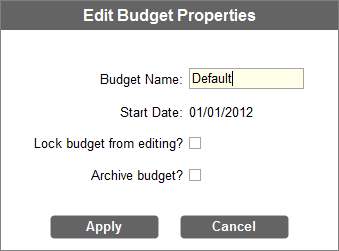
Here you can edit the:
- Budget Name - the given name for the budget
- Lock budget from editing - allows you to lock/unlock the budget from editing
- Archive budget - allows you to archive/un-archive the budget
Archiving Budgets
Archiving budgets is a way of hiding unwanted budgets from the budget drop down selector.
If you have archived one or more budgets you will see a new item appear at the bottom of the budget drop down selector. You will see either:
- Show archived Budgets - this item means that your archived budgets are currently hidden from view. Clicking on this option will cause the archived budgets to be shown.
- Hide archived Budgets - this item means that your archived budgets are currently visible. Clicking on this option will cause the archived budgets to be hidden from view.
If you see neither of these two items then you have no archived budgets to show or hide.
Show/Hide decimal point

Clicking on this button will cause the figures after the decimal point to be hidden/displayed in the budget table.
Delete ‘Specified’ Value

Clicking on this button will delete the value of the currently selected cell in the Budget Table only if it is not a calculated value.
Replace Specified Value with Calculated Value

Clicking on this button will replace the user specified value of the currently selected cell in the Budget Table with the calculated ‘sum’ value.
If the button is disabled then the selected cell is already equal to the calculated ‘sum’.
Adjust Period Values by Percentages

Click this button to adjust the period values for the currently selected row. After clicking this button the ‘Set Period Values as a Percentage of Total’ pop-up will appear:
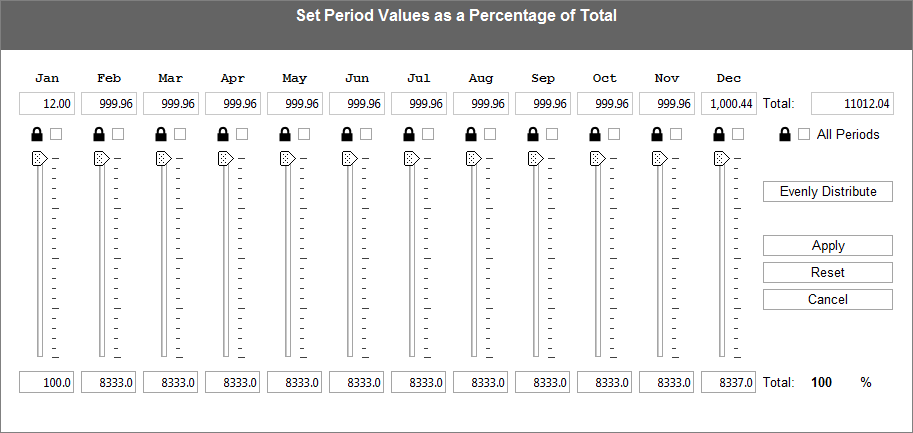
The ‘Set Period Values as a Percentage of Total’ pop-up shows the amounts for all the individual periods along the top and the individual period’s values as a percentage of the total . along the bottom.
Each period has a ‘slider’ that allows you to increase or decrease the percentage of total value for the given period. As you move the slider up the percentage of total value for that period will increase as all the other periods decrease (and vise-versa).
As soon as you edit a period’s percentage value (either by using the slider or editing the percentage figure directly) that period will become locked. Locking a period means that its percentage value will not be altered when you adjust another period’s value (which is useful when you want to precisely set two or more period’s values). You can lock and unlock periods via the check box above each period’s slider bar.
There are four buttons on the far right of the ‘Set Period Values as a Percentage of Total’ pop-up, these are:
- Evenly Distribute - will evenly distribute the total amount amongst all periods (overrides any period locks)
- Apply - set the current period values into the budget and closes the pop-up.
- Reset - reverts the period values back to what they were when the pop-up first opened.
- Cancel - disregards the current period values and closes the pop-up.
Print Budget

Clicking on this button will take you to the Document Editor from where you can design and print the data currently being displayed in the Budget Table.
Export Budget to CSV

Clicking on this button will bring up a ‘file save’ dialogue asking you to specify the name and location of the CSV file you wish to create. This file will contain all the data currently being displayed in the Budget Table.
Budget Table

The ‘Budget Table’ is linked with the ‘Accounts’ tree panel on the far left of the screen. Each row in the budget table corresponds to an account in the ‘Accounts’ tree panel.
This is best illustrated by expanding and contracting the account groups in the ‘Accounts’ tree panel, as you do this you will see that the number of rows shown in the budget table grow/shrink to match the number of accounts in the ‘Accounts’ tree panel.
The ‘Budget Table’ always consists of 13 columns, 12 periods and one total column. The first column represents the total yearly budget figure for the corresponding account.
Total Column
The total column always represents the sum of its corresponding 12 periods.
Entering a value in the ‘Total’ column will cause this value to be distributed amongst each of the 12 periods (either evenly distributed if no values currently exist for any of these periods, or distributed using the existing weightings of the period column’s current values).
Period Columns
The 12 period values for the lowest level (child) accounts in the ‘Accounts’ tree panel must be explicitly set by the user (either by manually setting each period value or setting a value in the total column that is automatically distributed amongst the 12 periods).
The 12 period values for an account group in the ‘Accounts’ tree panel automatically displays the total sum value for all its child values of the same period. The period values for a group account can be explicitly set by the user (to override the default calculated value) but the system will warn you if the explicitly set value does not match the calculated sum value by turning the cell red.
Error (Red) Cells
A cell that has a red background indicates that the value in this cell does not match the calculated sum of all its child values.
To quickly resolve this issue you can select the cell in error and then press the tick icon in the tool bar to correct the value to is expected amount.
Forecast Tab
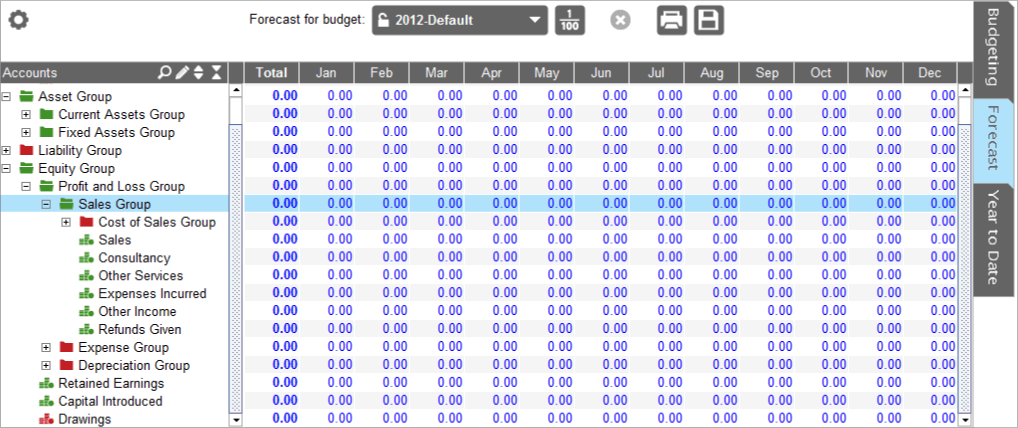
Each Forecast is tied to a particular Budget that it uses as the source for its starting values.
Until the forecast’s corresponding budget is locked the forecast remains uneditable. Once the forecast’s budget becomes locked then the forecast’s figures can be amended.
Tool Bar
The tool bar consists of:
Select Forecast for Budget

This drop down box allows you to pick which budget’s forecast to view/edit.
Show/Hide decimal point

Clicking on this button will cause the figures after the decimal point to be hidden/displayed in the forecast table.
Delete ‘Specified’ Value

Clicking on this button will delete the value of the currently selected cell in the Forecast Table only if it is not equal to the original budgeted value.
Print Budget

Clicking on this button will take you to the Document Editor from where you can design and print the data currently being displayed in the Forecast Table.
Export Budget to CSV

Clicking on this button will bring up a ‘file save’ dialogue asking you to specify the name and location of the CSV file you wish to create. This file will contain all the data currently being displayed in the Forecast Table.
Forecast Table
Total Column
The total column in the forecast table is never editable by the user. The total column’s value will always be the sum of the period columns.
Period Columns
The value of a period column in the forecast table is date dependant (dependant on the date that the user is looking at the forecast).
- Before and during the period column’s ‘time frame’ the column will display either the corresponding value from the (associated) budget or the amended (overwritten) value as set by the user in the forecast table.
- After the column’s ‘time frame’ has passed the period column will display the actual balance for that account for the given period’s ‘time frame’.
For example: the ‘Jan’ period column’s ‘time frame’ is from the 1st to the 31st of January
The 12 period values of an account group are never editable by the user, their values will always be equal to the sum of their children.
The 12 period values for the lowest level (child) accounts are editable by the user as long as the current date is not after the column’s ‘time frame’.
For example: the period ‘Jan’ will be editable up to (and including) 31st January. From 1st February the period’s values will not be editable
Year to Date Tab
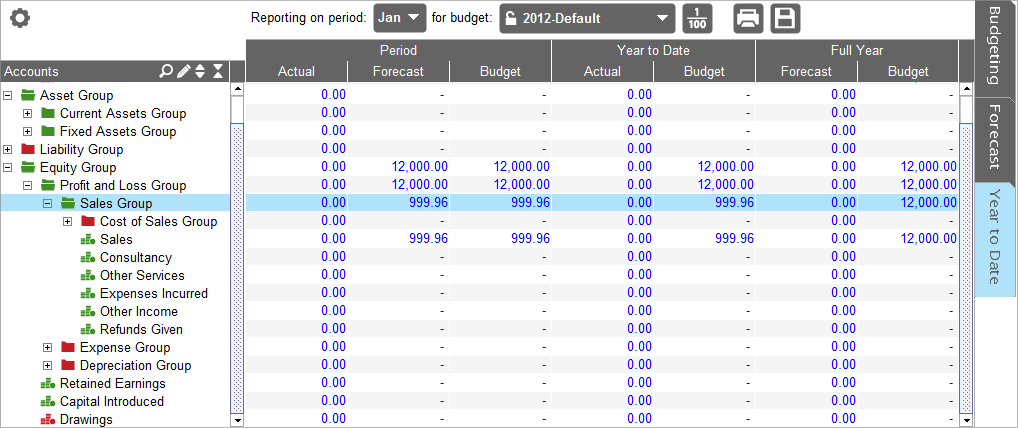
This tab offers an overview of the (specified) period, year to date, and projected full year figures.
Tool Bar
The tool bar consists of:
Reporting on Period

This drop down box allows you to pick which period’s ‘actual’ figures to compare against their ‘forecast’ and ‘budget’ values.
for Budget

This drop down box allows you to pick which budget’s figures to use in the Year to Date Table.
Show/Hide decimal point

Clicking on this button will cause the figures after the decimal point to be hidden/displayed in the forecast table.
Print Budget

Clicking on this button will take you to the Document Editor from where you can design and print the data currently being displayed in the Forecast Table.
Export Budget to CSV

Clicking on this button will bring up a ‘file save’ dialogue asking you to specify the name and location of the CSV file you wish to create. This file will contain all the data currently being displayed in the Forecast Table.
Year to Date Table
The ‘Year to Date’ table is a read-only report that brings together your budget, forecast and actual figures for the selected period, year to date, and full year projection.
The 7 columns are grouped into three distinct areas:
Period
This is defined as being from the first to the last date of the selected period
- actual - the current actual value for the selected period
- forecast - the value forecast for the selected period
- budget - the budgeted value for the selected period
Year to Date
This is defined as the first date of your financial year to the last date of the selected period
- Actual - The current actual value from the start of your financial year to the last date of the selected period
- Budget - The sum total of the budgeted values from the first period to the selected period
Full Year
This is defined as the the first to the last date of your financial year)
- Forecast - The sum of all the actual values up to the end of the last complete period that has occurred, plus the forecast figures for all the remaining periods in the year.
- Budget - The total budgeted figure for the year.
